I also learned that in the State Emergency Operations Center during a hurricane response we weren't able to do "right now." For certain things that were already in the State Logistics Staging Area (like bottled water) we might even be able to do "tomorrow." More likely it was going to be day after tomorrow. And if they wanted something that we hadn't already ordered it would be, well, days until they would get it. That is if the requester was lucky and everyone, including me, did everything right.
There was a lot of things that I remembered and a lot of things that I forgot after Charlie, Francis, Ivan and Jeanne paid us all a visit. My big takeaway was that we needed to be able to estimate mass care resource requirements before the damage assessments were completed and in some cases, before the event actually happened.
How in the world are you going to do that? you may ask. Think about it. If a Category 5 Hurricane is lined up on Miami and forecast to hit there tomorrow we don't need to say, "Well, as soon as the damage reports are compiled, probably a few days after the storm hits, we'll know what we need to order. We'll just have to wait until then to figure out what we need."
We have to do better than that.
The things we need to order are always the same: cots, field kitchens, shelter managers, bottled water. What we don't know are what numbers we need to put in the quantity blocks of the requisitions. What frequently happens are conversations like this:
MASS CARE GUY: I need cots.
LOGISTICS GUY: How many?
MASS CARE GUY: I have no idea.
LOGISTICS GUY: "I have no idea" doesn't fit in the quantity block of the requisition.
MASS CARE GUY (MAKES UP A NUMBER): What about 10,000?
LOGISTICS GUY (WHO DOESN'T CARE WHAT THE NUMBER IS BECAUSE YOU'RE JUST ONE MORE PROBLEM BETWEEN HIM AND THE END OF THE DAY): OK.
I've had those conversations during a disaster. More than once, I'm afraid to say. But what could I do? There wasn't a manual or instruction book explaining how to do all this stuff I was doing. I decided that there had to be a better way of doing things than making up the numbers.
After 10 years of talking, explaining and arguing with some knowledgeable mass care people we've come up with a process to estimate mass care resources. The process is crude and needs a lot of refining, but guess what? Doing it this way is better than making it up.
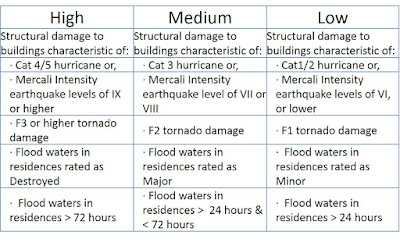
The demand for mass care resources after an event is based on three factors: population, intensity and vulnerability. The population numbers we can get from the Census. To estimate intensity levels we developed this chart:
 |
| Table to estimate event intensity. |
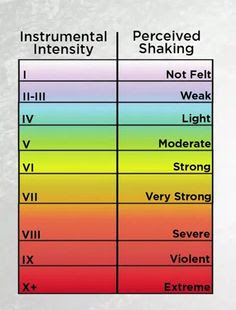
The PAGER system provides fatality and economic loss impact estimates following significant earthquakes worldwide. This information is usually available within hours of the quake and provides an immediate estimate of the number of persons affected. The USGS put out a PAGER ALERT for the Kumamoto, Japan earthquake that happened several weeks ago. The PAGER looked something like this:
The PAGER showed estimates of the number of persons affected by MMI level. Using the Event Intensity Table I came up with the number of persons affected by High (194k), Medium (1,410k) and Low (2,865k) intensities. I entered these population numbers into the Mass Care Planning Tool spreadsheet that we've developed to estimate mass care resource requirements
Remember: the demand for mass care resources is a function of population, intensity and vulnerability. Using the Intensity Table and the PAGER we were able to estimate the population affected by intensity. From these numbers we need to estimate the % of people who need to be fed and sheltered, for each intensity level. The percentages would vary according to the vulnerability of the people.
In some places, for example, the percentages for sheltering would be 10% for High, 5% for Medium and 1% for low. There are different percentages to estimate the feeding numbers. I had no idea what %'s to use to make a shelter estimate for a Japanese earthquake so I used the 10/5/1 that I had. The estimate using those percentages for the Kumamoto earthquake was 118,550 persons needing shelter (see Table below). Then I waited for the off chance that I might actually be able to get an estimate of the number of persons requiring shelter.
A few days later I read in the Wall Street Journal": “A total of 41 people were confirmed dead in Kumamoto prefecture, the epicenter of a magnitude 6.5 quake on Thursday night and a magnitude 7.3 quake 28 hours later early on Saturday. About 110,000 people were taking refuge at temporary shelters there as of Sunday afternoon, a Kumamoto prefecture spokesman said.”
Weather.com also reported that: “Local media reported that nearly 200,000 homes were without power and an estimated 400,000 households were without running water…[and] 180,000 are without shelter.”
Now that I had some actual numbers of people needing shelter I could see that the estimate of 118k needing shelter was low. The 10/5/1 shelter percentages that I used weren't high enough, and probably should have been higher. In other words, their vulnerability to the hazard was greater than I estimated.
As we socialize this estimation process in the mass care community and people start using it in disasters our ability to estimate these vulnerability percentages will improve. The conceptual framework for this estimation process has been included in the new FEMA L418 Course: Mass Care/Emergency Assistance Planning & Operations Course. This concept is also included in the new (soon to be released) Red Cross Feeding Standards & Procedures.
Like I said, the process is crude and needs a lot of refining. But take my word for it: estimating mass care resource requirements this way is one HECK of a lot better than making up the numbers.


